Artie vs. AWS DMS: Benchmarking Real-Time CDC From Postgres to Snowflake
Artie is a real-time database replication platform that streams changes from databases like Postgres and MySQL into warehouses and lakes. We handle the full pipeline – change data capture (CDC), merges, schema evolution, backfills, and observability – so your data team doesn't have to.
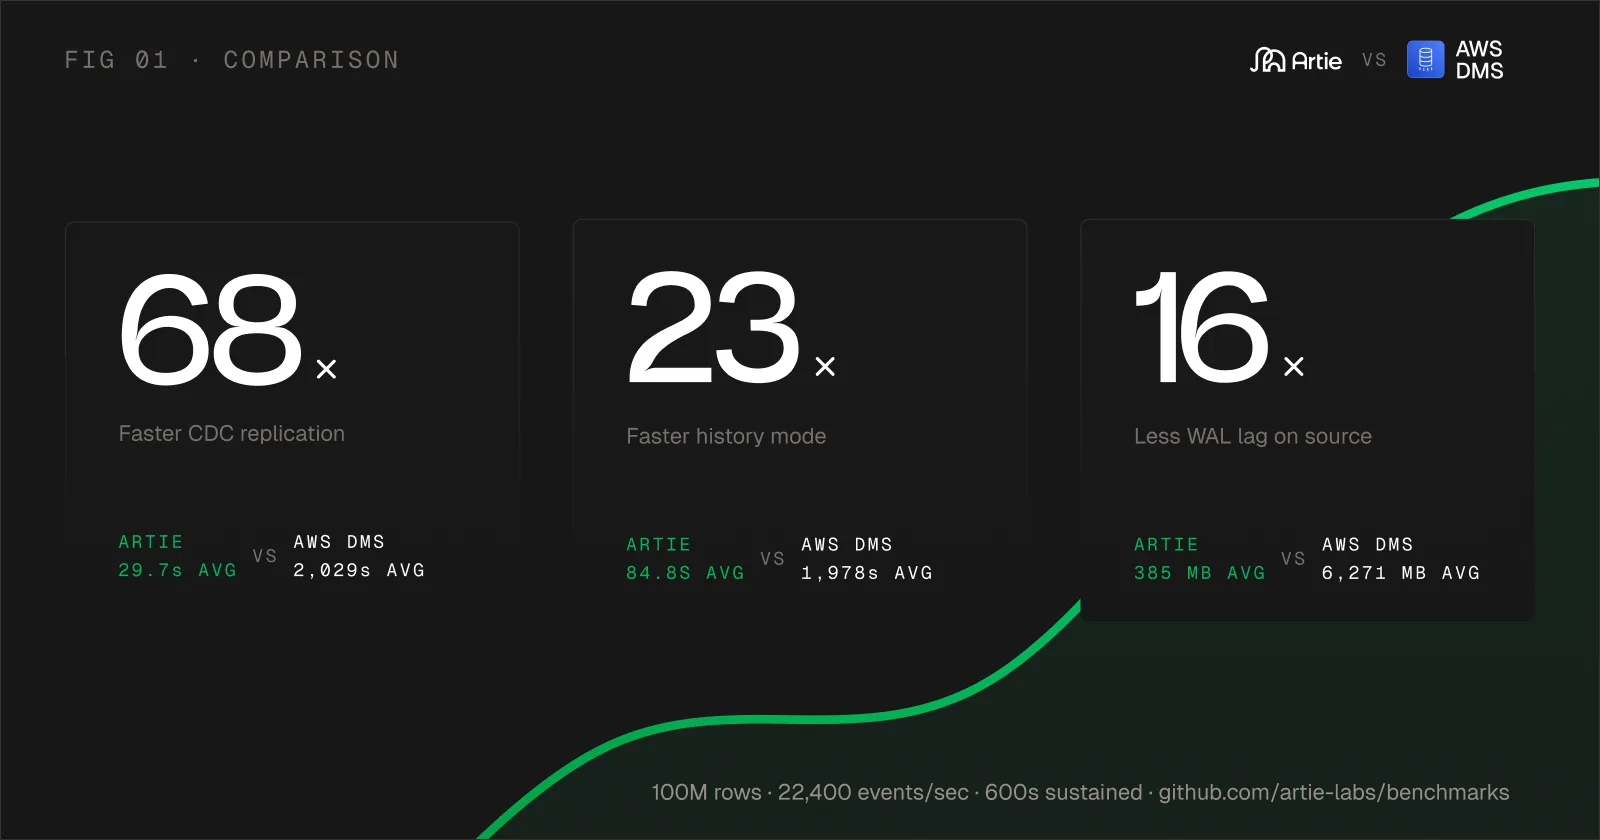
Under sustained production-level writes, AWS DMS fell 33 minutes behind the source database - and the gap was still growing. Artie stayed under 30 seconds.
We ran head-to-head benchmarks comparing Artie and AWS Database Migration Service (DMS) for replicating data from Postgres to Snowflake. We tested initial snapshots, ongoing CDC replication, history mode, and impact on the source database. Every configuration and query is documented below, and all code is published at github.com/artie-labs/benchmarks.
At a Glance
| Artie | AWS DMS | Delta | |
|---|---|---|---|
| Snapshot (100M rows) | 9m 36s | ~12m avg | Comparable |
| CDC replication latency (sustained) | 29.7s avg | 2,029s avg | 68x faster |
| CDC history mode latency (sustained) | 84.8s avg | 1,978s avg | 23x faster |
| WAL retention at end of test | 385 MB | 6,271 MB | 16x less |
| WAL trend | Plateaued | Still growing | – |
Why This Benchmark Matters
If your stack is on AWS and you need to replicate from Postgres into Snowflake, DMS is probably the first thing you'll try. It's the default. It's already in your AWS console. And for one-time migrations, it works fine – because that's what it was built for.
But CDC isn't a one-time migration. It's a continuous stream of changes flowing from your production database into your warehouse, ideally in near real-time. As write volumes go up, the architectural differences between a migration tool and a purpose-built streaming platform start to compound. We wanted to put real numbers on exactly how much they compound.
The question: Under sustained, production-level writes (~22,400 events/sec for 10 minutes straight), how do Artie and DMS compare on latency, throughput, and operational impact to the source database?
Setup
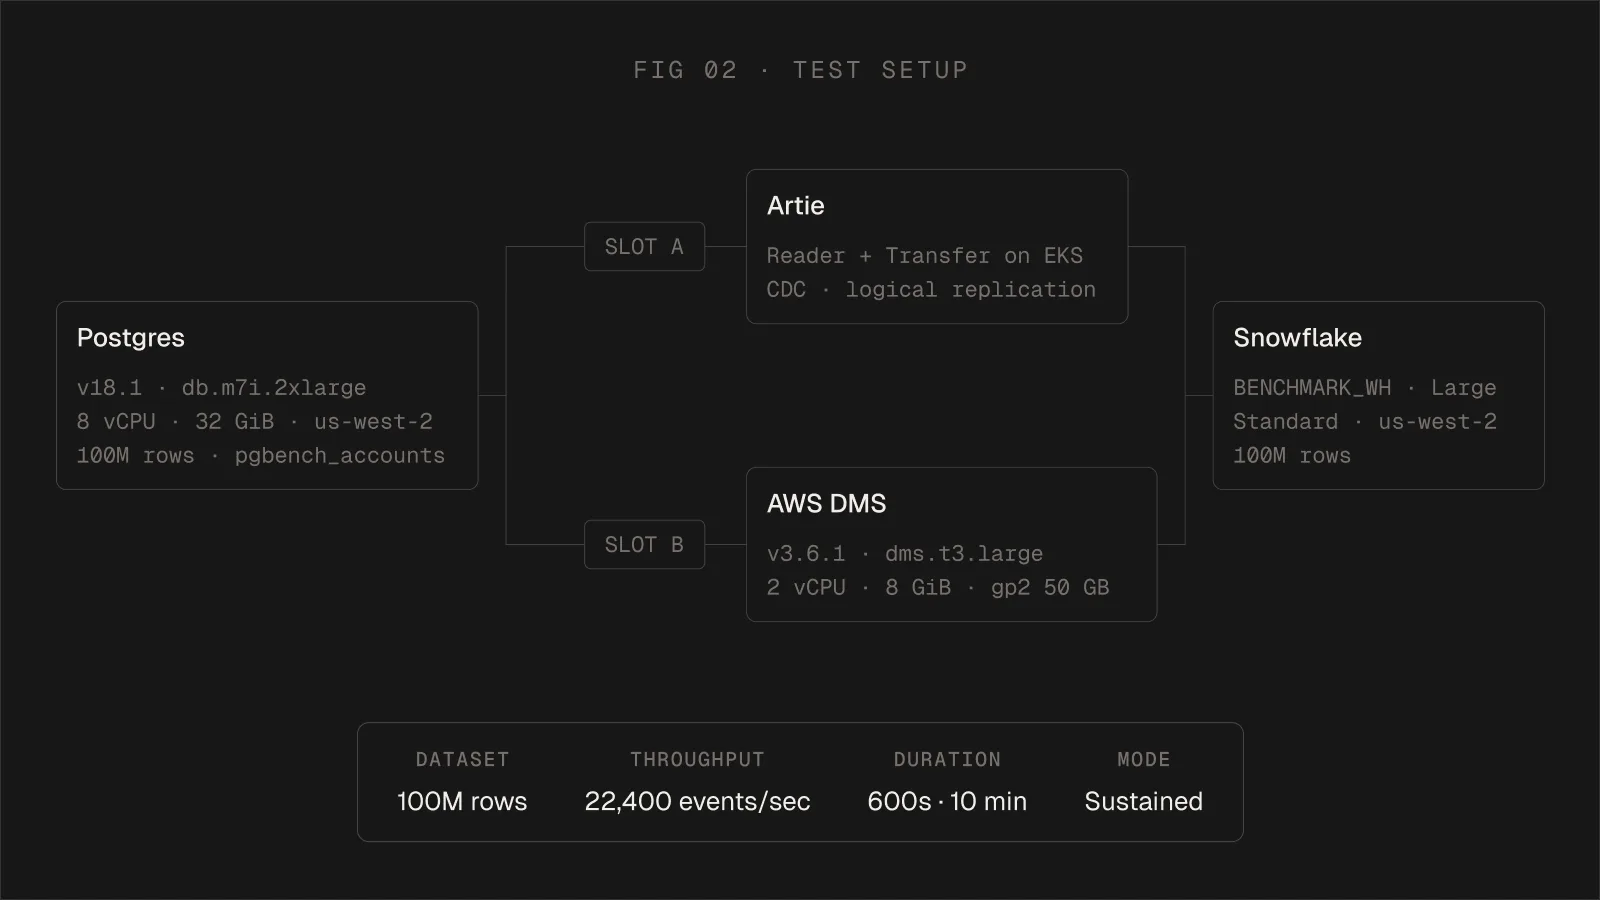
To ensure a fair comparison, both tools replicated from the same AWS RDS Postgres instance to the same Snowflake warehouse in the same region.
| Component | Specification | Configuration |
|---|---|---|
| Source | AWS RDS PostgreSQL 18.1 | db.m7i.2xlarge 8 vCPU, 32 GiB RAM, gp3 100 GB, us-west-2 |
| Destination | Snowflake, BENCHMARK_WH Size: Large Type: Standard | AWS us-west-2 |
| AWS DMS | dms.t3.large | 2 vCPU, 8 GiB RAM, gp2 50 GB, DMS v3.6.1 |
| Artie | Artie Reader (proprietary) Artie Transfer (open source) | Deployed as containers in EKS, resource usage measured per run |
| Dataset | pgbench_accounts | 100 million rows |
| CDC load | 50 concurrent clients, 8 threads, 600 seconds, ~22,400 events/sec (13.4M total events) |
All DMS task settings (batch sizes, buffer configs, error handling) are published in the benchmarks repo.
How the Pipelines Work
Before we get into results, it's worth understanding how these two pipelines are architected. This is where most of the performance gap comes from.
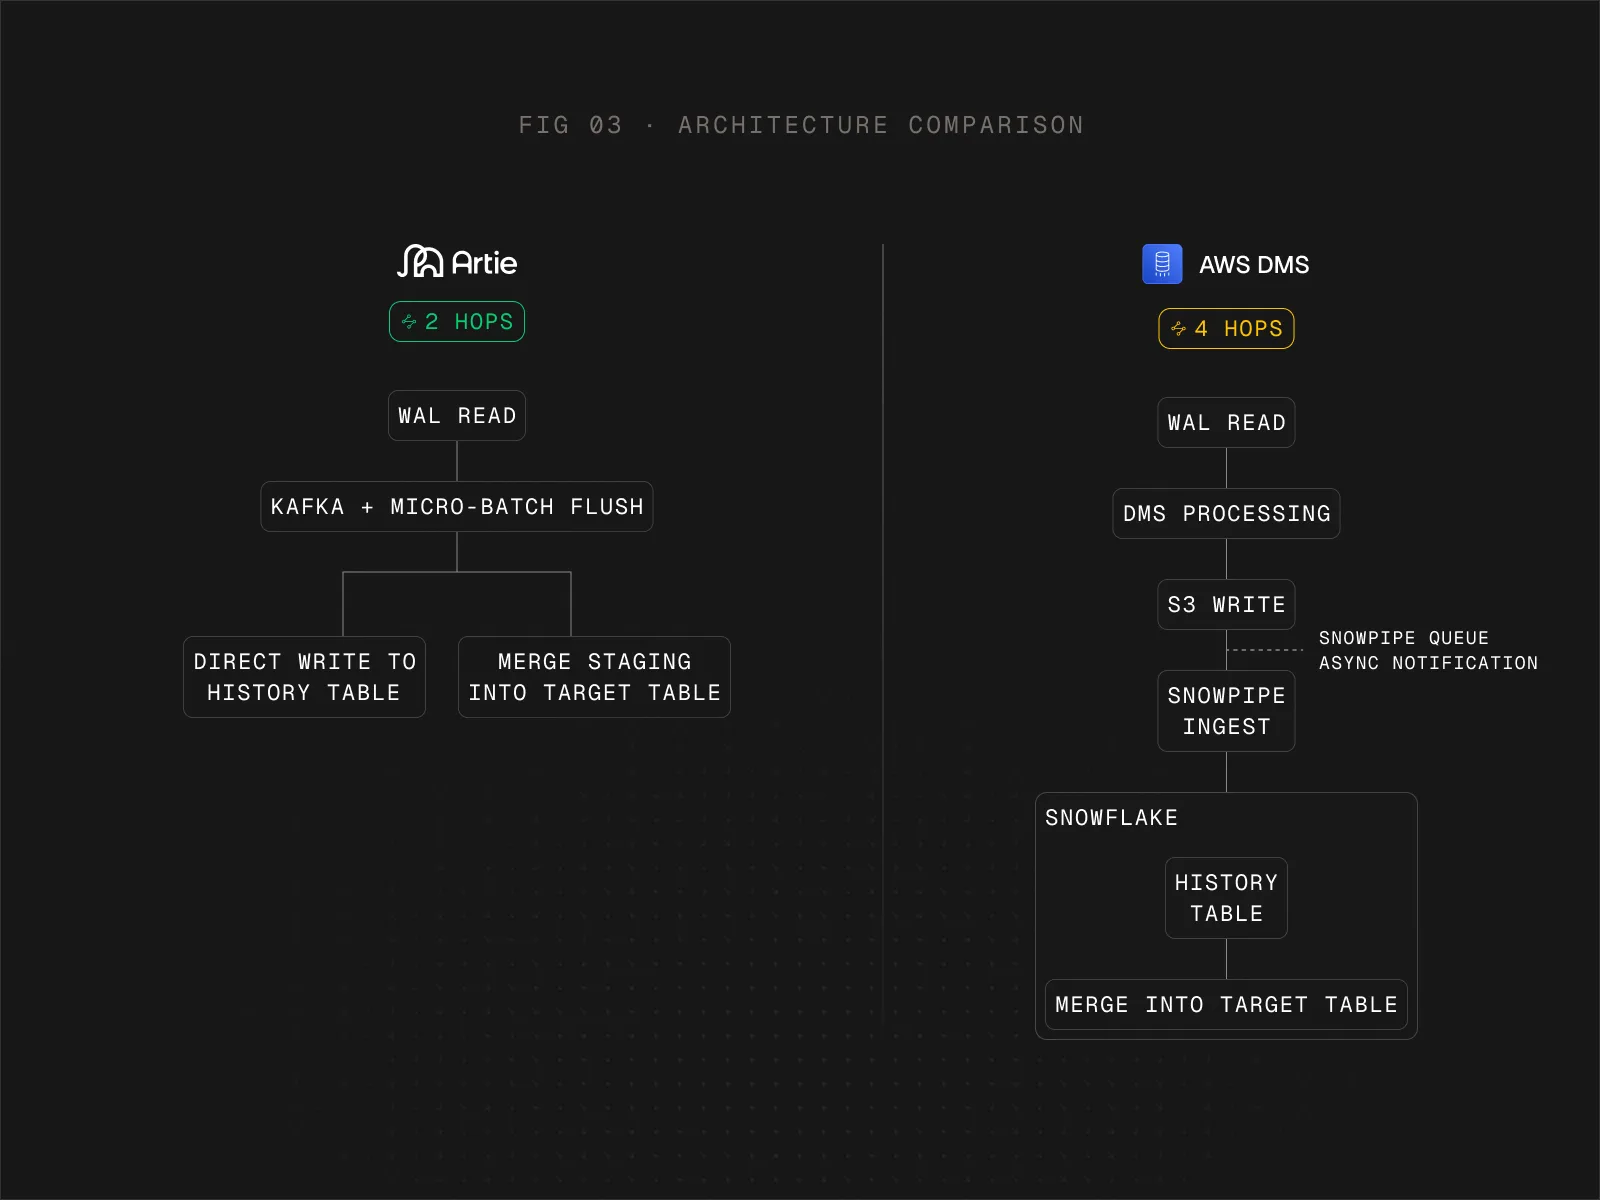
AWS DMS Pipeline (4 hops)
DMS reads from the Postgres WAL (Write-Ahead Log - the append-only log that Postgres uses internally for crash recovery and replication) and routes data through four stages before it lands in Snowflake:
- DMS Instance - buffers changes and serializes them into Parquet files. At 22,400 events/sec, the 2 vCPU instance becomes CPU-bound.
- S3 - file write latency plus batch accumulation delay.
- Snowpipe - an async queue with unpredictable notification delay.
- Merge Task - a separate consolidation step into the final table.
Artie Pipeline (2 hops)
Artie Reader reads directly from the Postgres logical replication stream, queues in Kafka, Artie Transfer buffers changes in memory, and flushes micro-batches to Snowflake using optimized MERGE statements. No intermediate storage, no S3, no Snowpipe.
Under low write volumes, the extra hops in the DMS pipeline may not matter much. Under sustained production load, the buffering at each stage compounds. That's the core of what these benchmarks measure.
Methodology
We used pgbench - PostgreSQL's built-in benchmarking tool - for all data generation and load testing. Nothing custom, nothing proprietary.
Populating the table (100M rows):
pgbench -i -I dtGvp -s 1000 postgres
Before each snapshot run:
-- Optimize page layout
VACUUM FULL pgbench_accounts;
-- Warm the RAM cache
SELECT COUNT(*) FROM pgbench_accounts;
Generating sustained CDC load:
We ran a custom TPC-B-like script that performs UPDATE, INSERT, and transaction operations across 100,000 distinct rows:
pgbench -f "custom_tpcb.sql"-c 50 -j 8 -T 600 -M prepared -P 5 -n postgres
\set aid random(1, 100000 * :scale)
\set bid random(1, 1 * :scale)
\set tid random(1, 10 * :scale)
\set delta random(-5000, 5000)
-- pipeline mode to reduce round trips
-- https://www.postgresql.org/docs/current/libpq-pipeline-mode.html
\startpipeline
BEGIN;
UPDATE pgbench_accounts SET abalance = abalance + :delta WHERE aid = :aid;
UPDATE pgbench_tellers SET tbalance = tbalance + :delta WHERE tid = :tid;
UPDATE pgbench_branches SET bbalance = bbalance + :delta WHERE bid = :bid;
INSERT INTO pgbench_history (tid, bid, aid, delta, mtime) VALUES (:tid,:bid, :aid, :delta, CURRENT_TIMESTAMP);
END;
\endpipeline
This generated 13,460,453 events in 600 seconds - an average of ~22,400 events per second.
Measuring End-to-End Latency
We embedded source timestamps into the filler column at write time. On the Snowflake side, we compared this against Snowflake's METADATA$ROW_LAST_COMMIT_TIME - the row-level commit timestamp - to compute true end-to-end latency:
SELECT
  DATE_TRUNC('minute', METADATA$ROW_LAST_COMMIT_TIME) AS minute,
  COUNT(*) AS row_count,
  AVG(DATEDIFF('second', FILLER::TIMESTAMP_TZ, METADATA$ROW_LAST_COMMIT_TIME)) AS avg_latency_s,
  MAX(DATEDIFF('second', FILLER::TIMESTAMP_TZ, METADATA$ROW_LAST_COMMIT_TIME)) AS max_latency_s,
  MIN(DATEDIFF('second', FILLER::TIMESTAMP_TZ, METADATA$ROW_LAST_COMMIT_TIME)) AS min_latency_s
FROM target_table
GROUP BY 1
ORDER BY 1;
The full custom SQL script and all measurement queries are in the benchmarks repo.
Results
1. Snapshot: Loading 100 Million Rows
Snapshot performance measures how fast each tool performs the initial backfill from Postgres into Snowflake. We ran multiple iterations of each tool, tuning parallelism where possible.
| Tool | Best run | Notes |
|---|---|---|
| Artie | 9m 36s | Improved from 67m (no parallelism) to 9m 36s with parallelism of 10 |
| AWS DMS | ~12m avg | ParallelLoadThreads unavailable for S3 targets; consistent ~11–14m across runs |
With parallelism tuned, Artie and DMS land in the same ballpark - both around 10–12 minutes for 100M rows. The key difference: Artie's snapshot speed scales with parallelism, while DMS's S3-target path doesn't expose that knob. At higher volumes, Artie’s snapshot speed really starts to compound.
2. CDC Replication Mode (Merge/Upsert)
Replication mode maintains a 1:1 copy of the source table in Snowflake. This is the most common CDC use case - keeping your warehouse in sync with production.
600 seconds of sustained writes at ~22,400 events/sec:
| Tool | AVG latency | MAX latency | MIN latency |
|---|---|---|---|
| Artie | 29.7s | 67s | 11s |
| AWS DMS | 2,029s | 2,041s | 1,829s |
Artie is 68x faster than DMS.
To put this in perspective: the test ran for 10 minutes. By the end, DMS was 33 minutes behind the source database. And the gap was still widening - it wasn't catching up.
If your dashboards, reverse ETL workflows, or downstream ML pipelines depend on fresh data in Snowflake, this is the difference between "near real-time" and "we're looking at data from half an hour ago."
3. CDC History Mode (SCD Type 4)
History mode creates a separate table that records every single data mutation - every insert, update, and delete - along with a timestamp and operation type. Think of it as a full changelog for your data. (In data warehousing, this pattern is called SCD Type 2, or Slowly Changing Dimension Type 2 - basically a history table that sits alongside your current-state table.)
This is what you need for audit trails, temporal analytics, and ML feature stores where point-in-time correctness isn't optional.
600 seconds of sustained writes at ~22,400 events/sec:
| Tool | AVG latency | MAX latency | MIN latency |
|---|---|---|---|
| Artie | 84.8s | 99s | 54s |
| AWS DMS | 1,978s | 1,986s | 1,811s |
Artie is 23x faster than DMS.
History mode is inherently more expensive than replication mode - every source event generates writes to both the current table and the history table. So latency is higher across the board. But Artie still kept it under 2 minutes. DMS blew past 30 minutes.
Under a short 10-second burst:
| Tool | AVG latency | MAX latency | MIN latency |
|---|---|---|---|
| Artie | 23.2s | 53s | 15s |
| DMS (Run 1) | 81.1s | 85s | 89s |
| DMS (Run 2) | 92.4s | 95s | 89s |
Even under a brief burst, Artie was 3.5–4x faster than DMS. The gap widens dramatically under sustained load because each hop in DMS's pipeline adds a bit more buffering delay, and those delays stack up as throughput increases.
4. WAL Lag: The Hidden Cost to Your Source Database
This is probably the most operationally important result in the whole benchmark.
Here's the deal: every CDC tool creates a replication slot on Postgres. A replication slot tells Postgres "don't throw away any WAL segments until I've confirmed I've processed them." If your CDC tool falls behind, WAL piles up on disk. And that's a problem.
High WAL retention means:
- Disk fills up on your source Postgres instance
- Query performance degrades as Postgres manages bloated WAL
- In extreme cases, the database goes down - a replication-slot-induced outage that takes your production database offline
We measured retained WAL at three checkpoints during the 600-second CDC run:
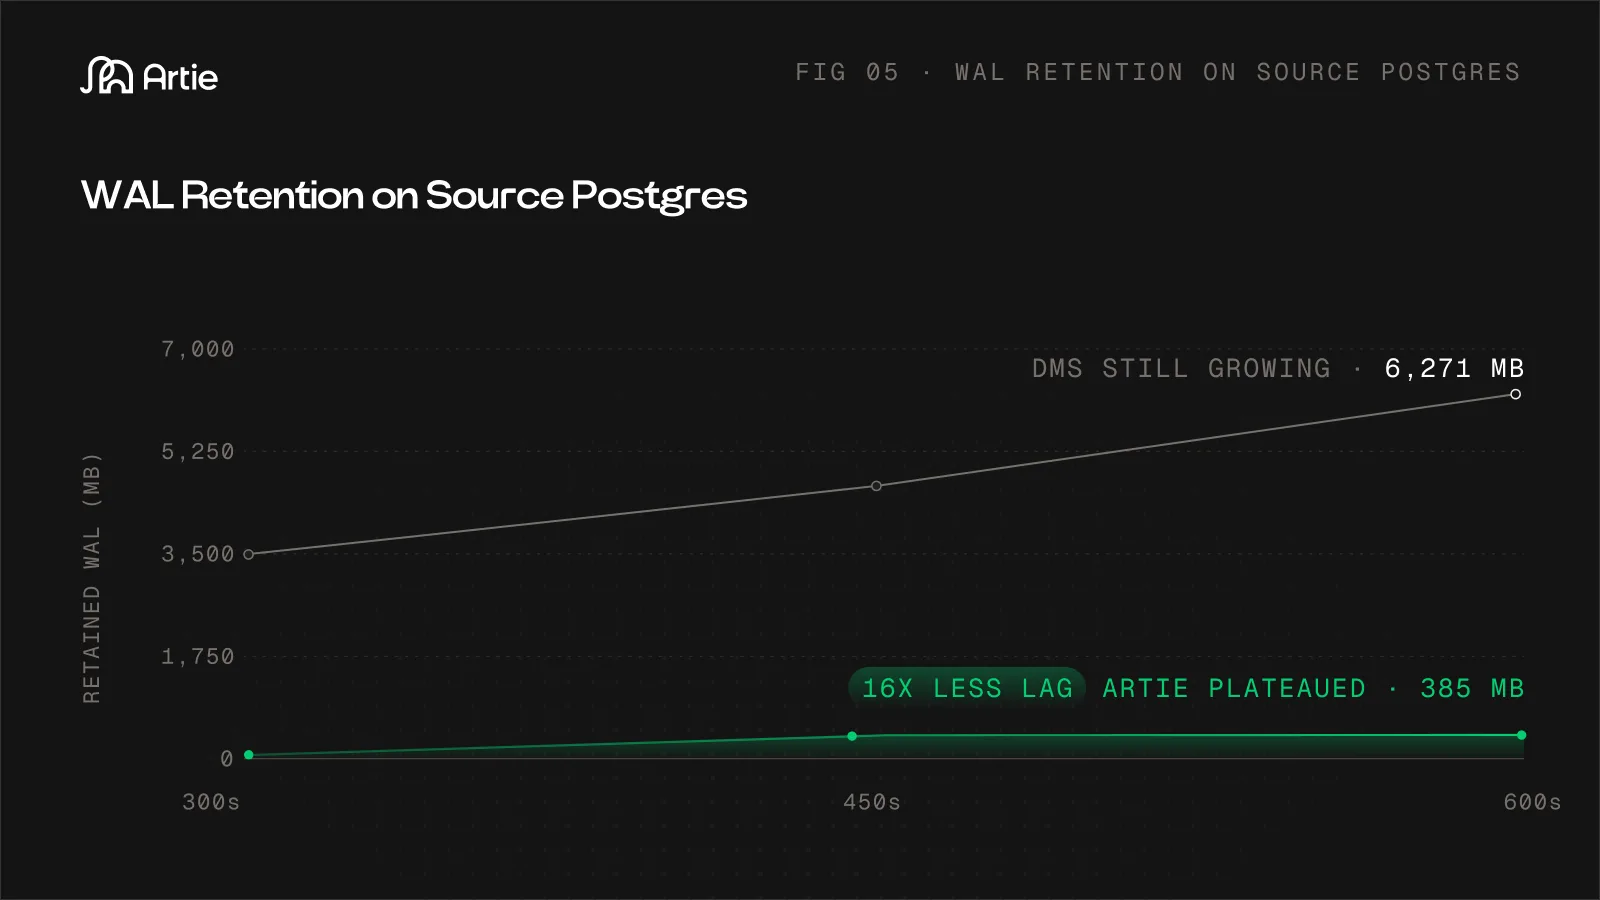
| Checkpoint | Artie | DMS | Ratio |
|---|---|---|---|
| 300s (midpoint) | 66 MB | 3,657 MB | 55x |
| 450s | 381 MB | 4,739 MB | 12x |
| 600s (end of test) | 385 MB | 6,271 MB | 16x |
At the end of the test, DMS had accumulated 6.1 GB of retained WAL. Artie held at 385 MB.
But the trend matters more than the absolute number. Between 450s and 600s, Artie's WAL retention barely moved (381 MB → 385 MB). It was processing changes about as fast as they were being produced. DMS's WAL was still growing linearly (4.7 GB → 6.3 GB) with no sign of leveling off.
If this test had run for an hour instead of 10 minutes, DMS would have retained tens of gigabytes of WAL on the source Postgres instance. If you're running CDC against a production database, that's the kind of thing that pages your on-call engineer at 3 AM.
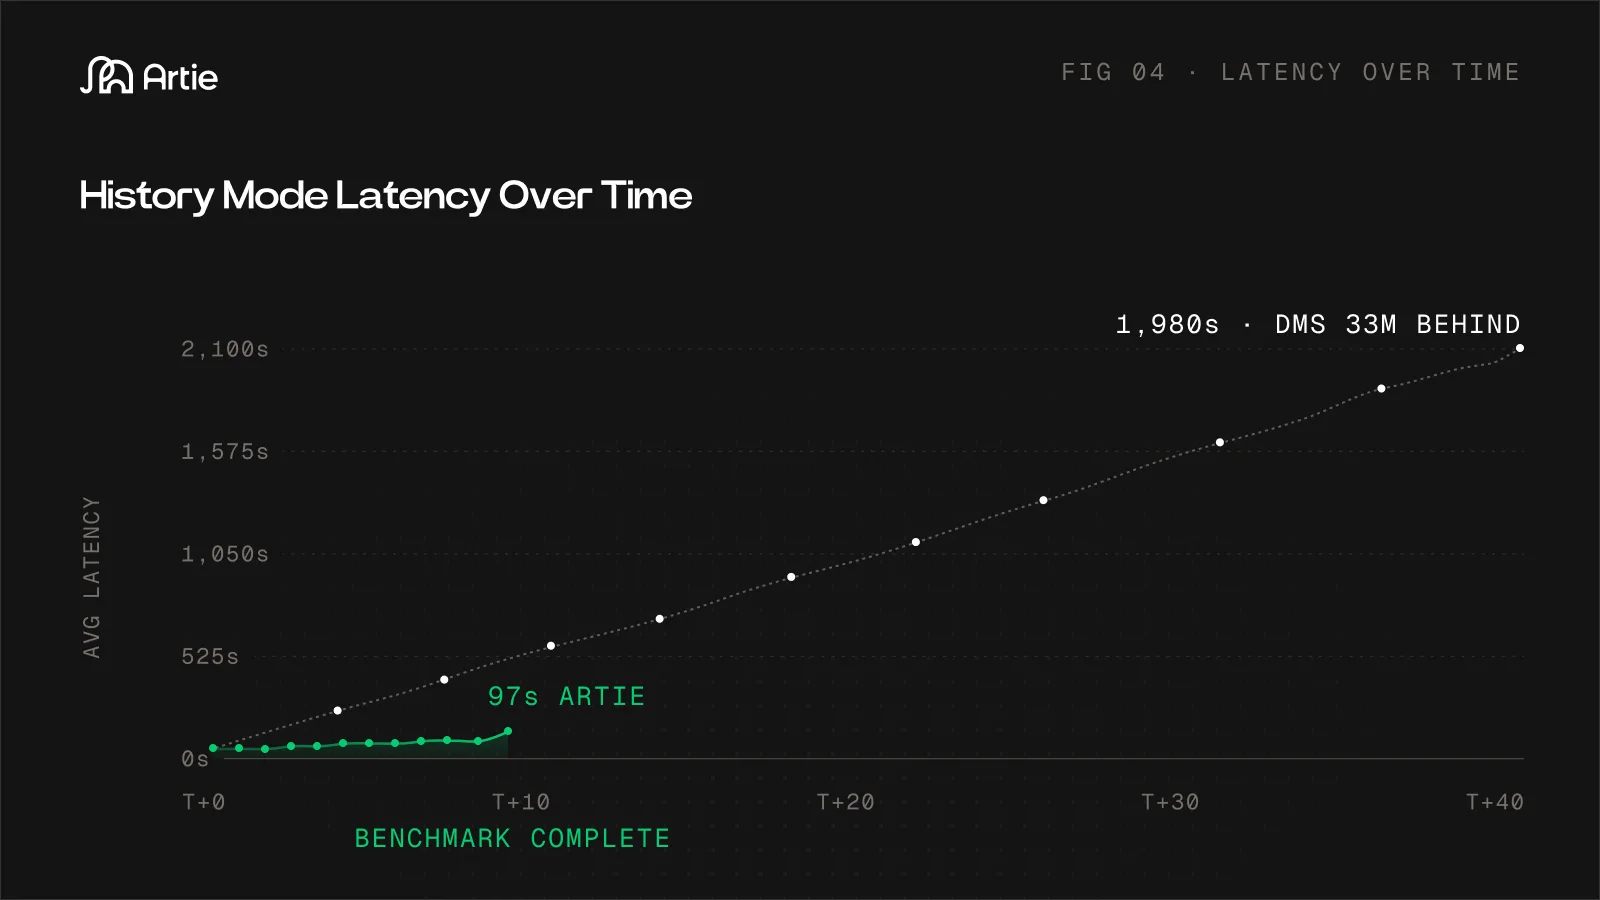
5. Latency Over Time: The Full Picture
The summary numbers are dramatic, but the minute-by-minute data is what really tells the story. These charts show average end-to-end latency measured every minute during the sustained CDC test.
DMS Latency Over Time - Latency starts at ~85s and climbs to nearly 2,000s (33 minutes). The line never flattens. DMS was still falling further behind when the test ended.
Artie Latency Over Time- Artie latency stays between 10s and 97s. It drifts up gradually under load but stays in the same ballpark.
Side-by-side at the same timestamp (22:25):
| Tool | Latency at 22:25 | Latency at 22:17 (start) | Trend |
|---|---|---|---|
| Artie | 53s | 14s | Gradual rise, bounded |
| DMS | 453s | 85s | Linear climb, unbounded |
Nine minutes in, DMS was already 8.5x slower than Artie. By the end of the test, DMS hit 1,980s while Artie's last reading was 97s - a 20x gap, and still growing.
Why the Gap Is So Large
You might be wondering: can you just tune DMS to close this gap? Throw it a bigger instance, tweak the batch sizes, adjust the buffer settings?
Short answer: no. The performance difference is architectural. You can optimize DMS's settings (and we tried - all our task configs are in the benchmarks repo), but you can't eliminate the fundamental overhead of routing data through four intermediate stages.
AWS DMS routes data through four stages:
- Postgres → DMS Instance - The DMS instance reads from the WAL and buffers changes.
- DMS Instance → S3 - Changes get batched into Parquet files and written to S3. Batching adds inherent delay.
- S3 → Snowpipe - Snowpipe notified for new files.
- Snowpipe → Snowflake - Files land in staging tables. A separate merge task consolidates them into the final table.
Artie collapses this into two stages:
- Postgres → Artie - Reads directly from the logical replication stream into Kafka.
- Artie → Snowflake - Two parallel writes, no intermediate file storage in either path:
- History table - Events are written directly, preserving the full changelog of every insert, update, and delete.
- Target table - A staging table is merged into the target using optimized MERGE statements, maintaining a 1:1 copy of the source.
Fewer hops, no disk I/O in the middle, and a merge engine that was purpose-built for continuous streaming - not one-time migrations.
The Schema Evolution Problem
Benchmarks tend to focus on throughput and latency under stable conditions. But production databases don't stay stable. Schemas change constantly - new columns get added, types get altered, columns get dropped or renamed. How a CDC pipeline handles those changes determines whether it's a tool you can trust in production or one that creates incidents.
With AWS DMS, all schema evolution is manual. When a column changes on the source, you have to pause the entire pipeline and then update the schema in every place it's referenced:
- The COPY statement that loads data from S3
- The history table definition
- The MERGE statement that reconciles staging with the target table
- The replication task configuration itself
If you miss any one of these, the pipeline either fails or - worse - silently writes incorrect data. And if you don't pause the pipeline before making these changes, events accumulate during the window where source and destination schemas are out of sync. At that point, the only recovery path is a full backfill.
This is what the process looks like for common schema changes:
| Schema change | AWS DMS | Artie |
|---|---|---|
| Add nullable column | Pause pipeline, update COPY + history table + MERGE + task config, resume, validate | Automatic – column appears in destination on next flush |
| Add non-nullable column | Same manual process, plus handle default values across all references | Automatic – default value propagated |
| Change column type | Pause pipeline, alter all downstream DDL, risk type mismatch if any step is missed | Automatic – type change detected and applied |
| Drop column | Pause pipeline, update all references, remove from MERGE logic | Automatic – column removed from destination |
| Rename column | Pause pipeline, treat as drop + add across all references | Automatic – rename propagated |
For teams running DMS against databases with frequent schema changes, this becomes a recurring operational burden. Each change carries the risk of a failed pipeline, corrupted data, or a forced backfill - and the manual steps multiply across every table under replication.
Artie handles schema evolution automatically. When the source schema changes, the platform detects the change in the CDC stream and applies it to the destination without pausing replication or requiring manual DDL updates. No events are lost, no backfill is needed, and the pipeline continues without interruption.
This wasn't part of our quantitative benchmark, but in practice it's one of the largest differences in operational cost between the two systems.
If you're evaluating CDC tools for Postgres to Snowflake and want to see how Artie handles your workload, book a demo or try Artie.
Reproducing This Benchmark
We're publishing everything. No cherry-picked configs, no hidden settings. All configurations, scripts, and queries are in the open:
- Benchmark code and configs: github.com/artie-labs/benchmarks
- pgbench: Bundled with PostgreSQL
- Latency measurement: Snowflake's
METADATA$ROW_LAST_COMMIT_TIME - DMS task settings: Published in the benchmarks repo
If you run these benchmarks yourself and get different results, we genuinely want to hear about it - reach out.
Conclusion
For snapshots, both tools land in the same ballpark - around 10-12 minutes for 100M rows.
The real story is CDC. Under sustained production-level writes:
- Replication mode: Artie averaged 29.7 seconds. DMS averaged 33+ minutes and was still falling behind. (68x)
- History mode: Artie averaged 84.8 seconds. DMS averaged 33 minutes. (23x)
- Source database impact: Artie retained 385 MB of WAL. DMS retained 6.3 GB and was still growing. (16x)
This isn't about configuration. We published every DMS setting we used. The gap is architectural - four intermediate stages vs. a direct stream.
Appendix: Latency Over Time
The raw data and the scripts used to generate these charts are available in the GitHub repo: github.com/artie-labs/benchmarks.


