
Flush Metrics Now Available in Analytics
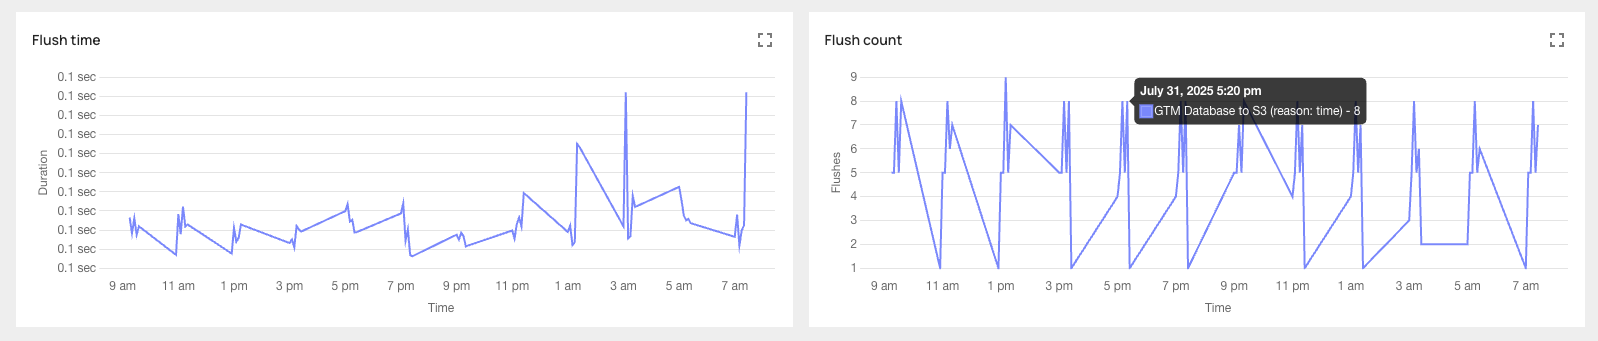
Flush Metrics in the Analytics dashboard show how often data flushes, which flush rule triggered it, and how long it took.
For teams replicating high-volume data into destinations like Snowflake, BigQuery, or Postgres, setting the right flush rules is key to balancing freshness, cost, and performance. But without visibility, tuning those rules can feel like guesswork.
Flush rules let you control when data gets written from Artie's streaming buffer to your destination - based on time intervals, row counts, or byte thresholds. With Flush Metrics, you now get a clear view into how those rules are performing.
Take a healthtech team syncing MySQL to BigQuery: they've configured a 60-second or 1MB flush rule. Now, they can see exactly how often data flushes, what triggered it, and how long it took - helping them optimize for cost and latency without guessing.
Why this matters:
- Tune pipelines with data - not guesswork
- Validate whether your flush rules are hitting SLAs
- Optimize for warehouse costs by spotting over-frequent writes
- Troubleshoot delays and fine-tune performance in seconds
Head to the Analytics dashboard or read the docs for how to get started. Need help tuning? We're here.