How to Build Audit Logs Using CDC and SCD Type 2
Artie is a fully-managed CDC streaming platform that replicates database changes into warehouses and lakes without the complexity of DIY pipelines. It delivers production-grade reliability at scale, without ongoing maintenance.
TL;DR
In this blog, we’ll walk step-by-step through how to build audit log support into your own product. This is the approach we use at Artie to track every change to our pipeline configurations, down to the field level. Our own History Mode feature powers our audit logs, giving customers visibility and helping us debug issues fast.
In this guide you’ll learn how to:
- Build audit logs using Change Data Capture (CDC) + Slowly Changing Dimension (SCD) Type 2 Tables
- Use PostgreSQL JSONB diffs for field-level change tracking
- Combine history tables for related entities
- Mask sensitive data using Go struct tags
- Build a timeline-style audit log UI
Why It Matters
Exposing pipeline history in our product has been a massive unlock for our customers:
- Faster root cause analysis: When something breaks, you don’t want to guess what changed. You want to see exactly who did what, when, and why.
- Compliance and auditing: Many teams need to meet SOC 2 or HIPAA requirements. Having a structured, queryable change history makes it easy to generate audit trails on demand.
- Proactive debugging: Spotting misconfigurations before they cause issues is easier when you have a full timeline of changes.
- Customer support acceleration: Our support team uses this to instantly answer "Did anything change?" when helping customers debug pipeline behavior.
Here’s a scenario we used to see customers run into: someone on their data team made a small change to a pipeline setting, saved it, but forgot to deploy the change. The pipeline was then marked as “dirty” in our system, because it had configuration changes that weren’t live in their actual infrastructure yet.
A few weeks later, an engineer from the same company needed to rotate credentials for a source database. They went to update this in our UI, but they saw a warning that the pipeline had “undeployed changes”. They didn’t know what else had been changed, so they weren’t sure whether it was safe to deploy their credential change.
It became clear to us that our users need to know more than just whether a pipeline has undeployed changes. They need to know what those changes are, when they were made, and by who.
Complications
The challenge in building a thorough audit log is that pipeline configurations are complex and interconnected. In our data model, the configuration for a pipeline is stored not just on a record in our pipeline table but also in a handful of related objects:
- Source and destination connectors (which can be shared by multiple pipelines)
- Source readers (generally specific to a pipeline but can be shared for advanced use cases)
- Per-table configuration (a pipeline can contain many tables)
- Optionally: SSH tunnels or Snowflake Eco Mode schedules (also shareable across pipelines)
We needed a way to track every single change to these components, across all entities, without cluttering our production database. And we wanted it to be fast to query, easy to use, and low maintenance.
For the answer, we turned to dogfooding our own product.
Streaming History with SCD Type 2
Artie's History Mode creates a Slowly Changing Dimension (SCD) table for any source table. Instead of overwriting rows in the destination when an update happens, Artie inserts a new row for every change – capturing the full state of that entity at that moment in time. We support both SCD Type 2 (streaming changes into a history table) and SCD Type 4 (keeping a separate history table in addition to a table that’s kept fully in sync with the source table).
When you enable history mode for a table, Artie creates a __history-suffixed table for it (e.g., pipeline__history). Whenever a row is added/changed/removed from the source table, the history table stores:
- The full row snapshot
- The timestamp of the change
- The operation type: create (
c), update (u), delete (d)
For our use case, we also added user metadata (updated_by) to each of our source tables in order to track who made each change. Here’s a simplified example schema:
Source table: pipeline
| id | name | status | updated_by |
|---|---|---|---|
| 1 | Postgres to Snowflake | running | user 1 |
| 2 | MongoDB to Redshift | draft | user 2 |
Destination table: pipeline__history
| id | name | status | updated_by | __artie_updated_at | __artie_operation |
|---|---|---|---|---|---|
| 1 | Postgres to Snowflake | draft | user 2 | 2025-11-29 08:42:38 | c |
| 2 | MongoDB to Redshift | draft | user 2 | 2025-11-30 11:14:07 | c |
| 1 | Postgres to Snowflake | running | user 1 | 2025-12-02 19:39:13 | u |
In this example, you can see that user 2 created both of these pipelines, and then user 1 deployed the “Postgres to Snowflake” pipeline a few days later.
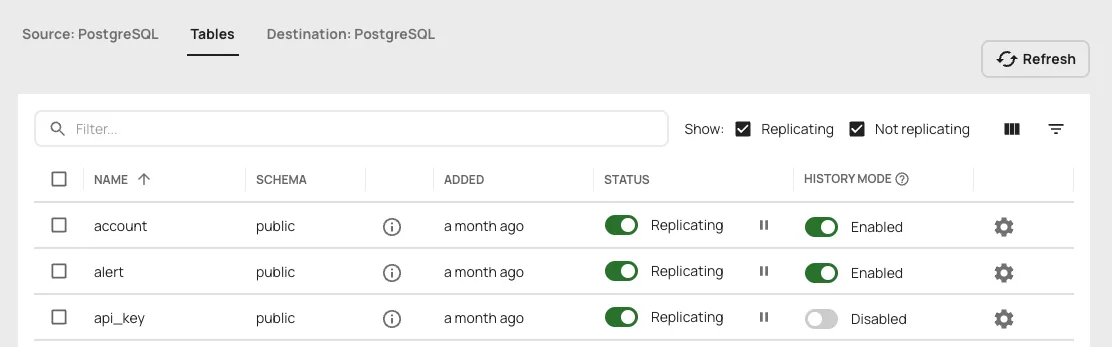
In the Artie UI, you can enable history mode for a table with one click:
Tracking Who Made Changes (Audit Log Actor Pattern)
Every change in our system is attributed to an "actor" – the entity responsible for making the change. The above example showed a simplification of how we track this; in reality, we use a flexible pattern that handles three different types of actors:
The Actor is stored as JSONB in PostgreSQL, making it flexible and queryable:
Why Three Actor Types?
1. Account (human users)
When a user logs into the dashboard and makes a change, we record their account UUID. This is the most common case and provides clear accountability.
2. API key (programmatic access)
Customers can create API keys for programmatic access to our API, e.g. to manage resources with Terraform. When a pipeline is updated via API key, we need to know which API key was used. This is crucial for debugging and security – if an API key is compromised, we can trace all changes it made.
3. System (automated changes)
Some changes are made by our system automatically – for example, when we auto-update a pipeline's last_deployed_at timestamp or when background jobs modify configuration. We track these as system actors and typically filter them out of the user-facing audit log.
Here's the filter we apply at the end of our history query:
Impersonation Support
The optional ImpersonatorUUID field is particularly useful for admin support scenarios. When our support team needs to help a customer debug an issue, an admin might impersonate their account. The audit log records both:
- Who was impersonated (in
UUID) - Who did the impersonating (in
ImpersonatorUUID)
This provides a complete audit trail for compliance and security purposes.
Displaying Actors in the UI
In our frontend, we enrich the Actor data with human-readable labels. An account UUID gets resolved to a name like "Dana Fallon", and an API key UUID gets resolved to a label like "Production Deploy Key".
Querying Audit Logs with SQL + JSONB Diffs
Tracking history is only half the story. We also needed a clean way to query it for diffs: what exactly changed between version A and version B?
One way to extract these changes would be to query the history table for its raw data and then programmatically diff each row against the same entity’s previous row. We initially explored this approach but found that it would require a lot of hardcoded custom logic related to our data models, it could be computationally expensive, and it would make pagination difficult.
Instead, we had the idea to push this complexity to the SQL layer for better performance and to keep our downstream code simple. By distilling each row down to a json object and diffing those, we could keep the core of the query generic and reusable.
Here’s a simplified version of our diffing query, with more detailed explanations below:
This query does several clever things. Let's break down some key design decisions:
Why JSONB Diffs Instead of Comparing Columns Individually?
Instead of writing SQL like this:
We convert each row to JSONB and compare the entire object:
The benefits:
1. Schema Evolution
When we add a new column to the pipeline table, the JSONB diff automatically includes it – no query changes needed. With explicit column comparisons, we'd have to update the query every time the schema changes.
2. Maintainability
Our actual query handles 6 different entity types (pipelines, connectors, SSH tunnels, etc.), each with different schemas. Using JSONB means we can use a generic query builder instead of hard-coding column comparisons for each type.
3. Nested Fields
Some of our fields are JSONB columns themselves (like advanced_settings). The JSONB approach handles nesting easily:
4. Null Handling
IS DISTINCT FROM properly handles NULL values (unlike !=), which is crucial for optional configuration fields.
The tradeoff of this JSON diffing approach is that we're serializing rows to JSONB on every query, but the gains in flexibility and maintainability far outweigh the minor performance cost.
Why lag() Instead of a Self-Join?
You might wonder why we use window functions instead of the traditional self-join approach:
Window functions are cleaner and more efficient:
1. Readability
lag(row_json) OVER (PARTITION BY uuid ORDER BY updated_at) clearly expresses intent: "get the previous value for this entity, ordered by time."
2. Performance
Modern PostgreSQL query planners optimize window functions well. The self-join approach requires a correlated subquery that runs for each row, while lag() is computed in a single pass during the window function evaluation.
3. Guaranteed Ordering
Window functions make the ordering explicit in the OVER clause. With self-joins, it's easier to introduce subtle bugs if the join conditions aren't perfectly aligned.
4. Simplicity
Getting multiple "previous" fields just requires multiple lag() calls. With self-joins, you'd need additional joins or more complex subqueries.
Detecting Soft Deletes
We use a soft delete pattern in our production database – instead of physically deleting rows, we set a deleted_at timestamp. This is safer (you can "undelete" by clearing the timestamp) and better for audit trails, but it means the database operation is actually an UPDATE, not a DELETE.
Artie faithfully replicates this – it sees an UPDATE operation and streams it as such. But for our audit log, we want to show soft deletes as actual deletions. Here's how we detect them:
Step 1: Get the previous deleted_at value using lag()
Step 2: Detect the transition from NULL to NOT NULL
The logic:
prev_deleted_at IS NULL→ The entity was NOT deleted beforedeleted_at IS NOT NULL→ The entity IS deleted now- Therefore, this update represents a soft delete, so we override the operation from 'u' to 'd'
In summary, the result of this diff query looks like this:
Building a Full Audit Log Timeline Across Related Entities
As mentioned above, a pipeline isn't just a single record in our database. To debug real issues, we need to know what else changed around the same time, across all the pipeline's related objects.
We query history tables for all related entity UUIDs, union them together, and sort by timestamp. This gives us a timeline view of everything that changed:
Masking Sensitive Fields in Audit Logs (Passwords, Keys, Tokens)
One crucial challenge with audit logging is handling sensitive data like database passwords, API keys, and tokens. You need to track that these secrets changed without exposing their actual values in your audit logs.
Our approach uses a two-stage process: SQL detects changes, then Go code masks sensitive values.
Stage 1: SQL Detects Config Changes
When connector configurations change, the SQL query detects that the config field changed, but it only returns the raw JSONB blobs (containing encrypted secrets). It doesn't know which specific fields within the config are sensitive:
This returns something like:
Stage 2: Go Code Processes and Masks
The real magic happens in our Go code that post-processes these history entries. We use struct field tags to mark sensitive fields, then use reflection to mask them:
When processing connector config changes, we:
- Unmarshal the old and new config blobs from the SQL result
- Decrypt the encrypted fields (so we can compare them properly)
- Diff the configs field-by-field using reflection
- Mask any fields tagged with
sensitive:"true" - Replace the generic "config changed" entry with detailed field-level diffs
Here's the processing code:
The Result
After this processing, the audit log shows exactly which fields changed, with sensitive values masked:
We know that:
- The account URL changed (and we can see what it changed to)
- The private key changed (but we don't expose the actual values)
- Who made the change and when
Why This Two-Stage Approach?
Since we support a variety of connectors and need to store different info for each of them, connector configurations are stored in a single JSONB column called config. The SQL query can't easily introspect which fields within that JSONB are sensitive – it would require hardcoding knowledge of every connector type's schema.
By handling it in Go, we get:
- Type safety: We have strongly-typed structs for each connector type
- Flexibility: Adding a new sensitive field is as simple as adding
sensitive:"true"to the struct tag - Decryption: We can decrypt the encrypted values to properly compare them (detecting actual changes vs. re-encryptions)
- Field-level granularity: We transform the opaque "config changed" into detailed "password changed, host changed" entries
Putting It All Together
With all of this implemented, we can now display a full audit log of all the changes that have been made to a pipeline:
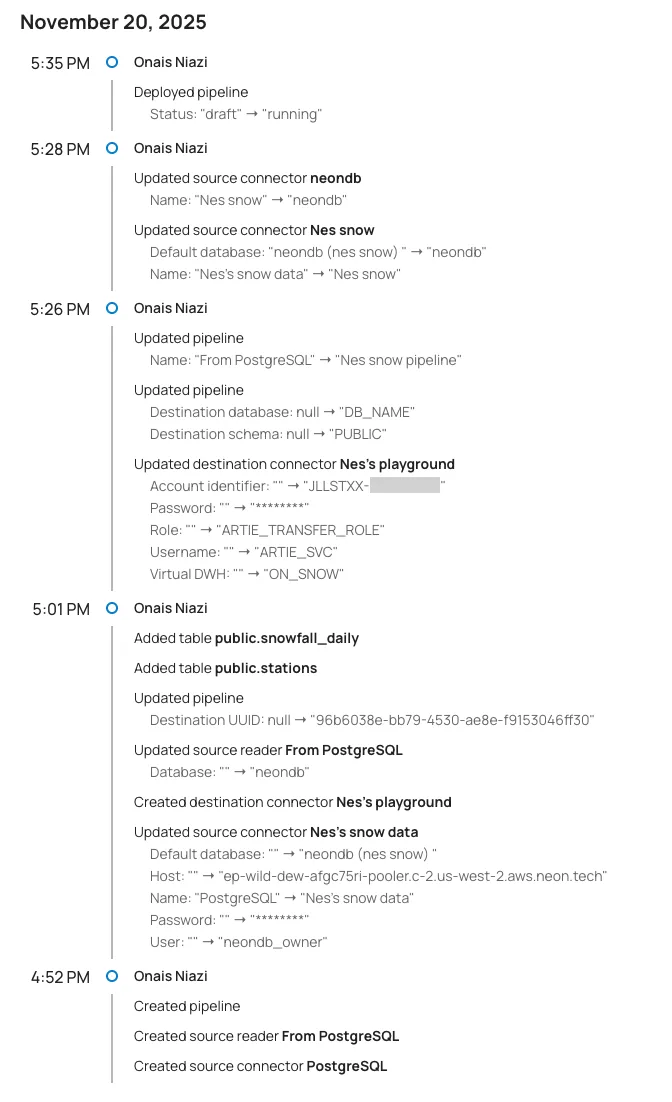
We build this timeline view with some simple frontend code to group the changes by time and actor:
Trade-offs
If you decide to follow this guide to implement audit logs for your own product, keep in mind that enabling history mode for your tables will increase your billable monthly rows processed with Artie. If you have concerns about potential cost increases, we’d be happy to provide estimates before you turn on history mode.
Additionally, the SQL query we outlined here may start to encounter performance problems depending on the size of your data. If this happens, you may want to optimize further by:
- Adding a view that dedupes the no-op changes so the query doesn’t have to sort through these at run time (e.g. rows where only metadata or system-specific fields changed)
- Adding a background job that does periodic compaction, deleting the no-op change rows from the history table
How To Replicate This (Pun Intended)
In summary, you can add support for audit logs in your own product by following these steps:
- Create a pipeline in Artie that reads from your app database and writes to another database your app can connect to. For example, we use a separate PostgreSQL database in the same cluster as our app DB.
- Make SQL do the heavy lifting: use JSON diffs in your query to isolate changes at the field level, so your downstream code doesn’t need to sift through all the raw data.
- Start with one entity, then expand to related entities.
With this approach, you can unlock support for operational audit logging, compliance tracking, and debugging. If you’re already using Artie, you get these history tables out of the box. If not, this is the exact kind of CDC-powered audit logging you can get without building any of the plumbing.


